Our newsletter
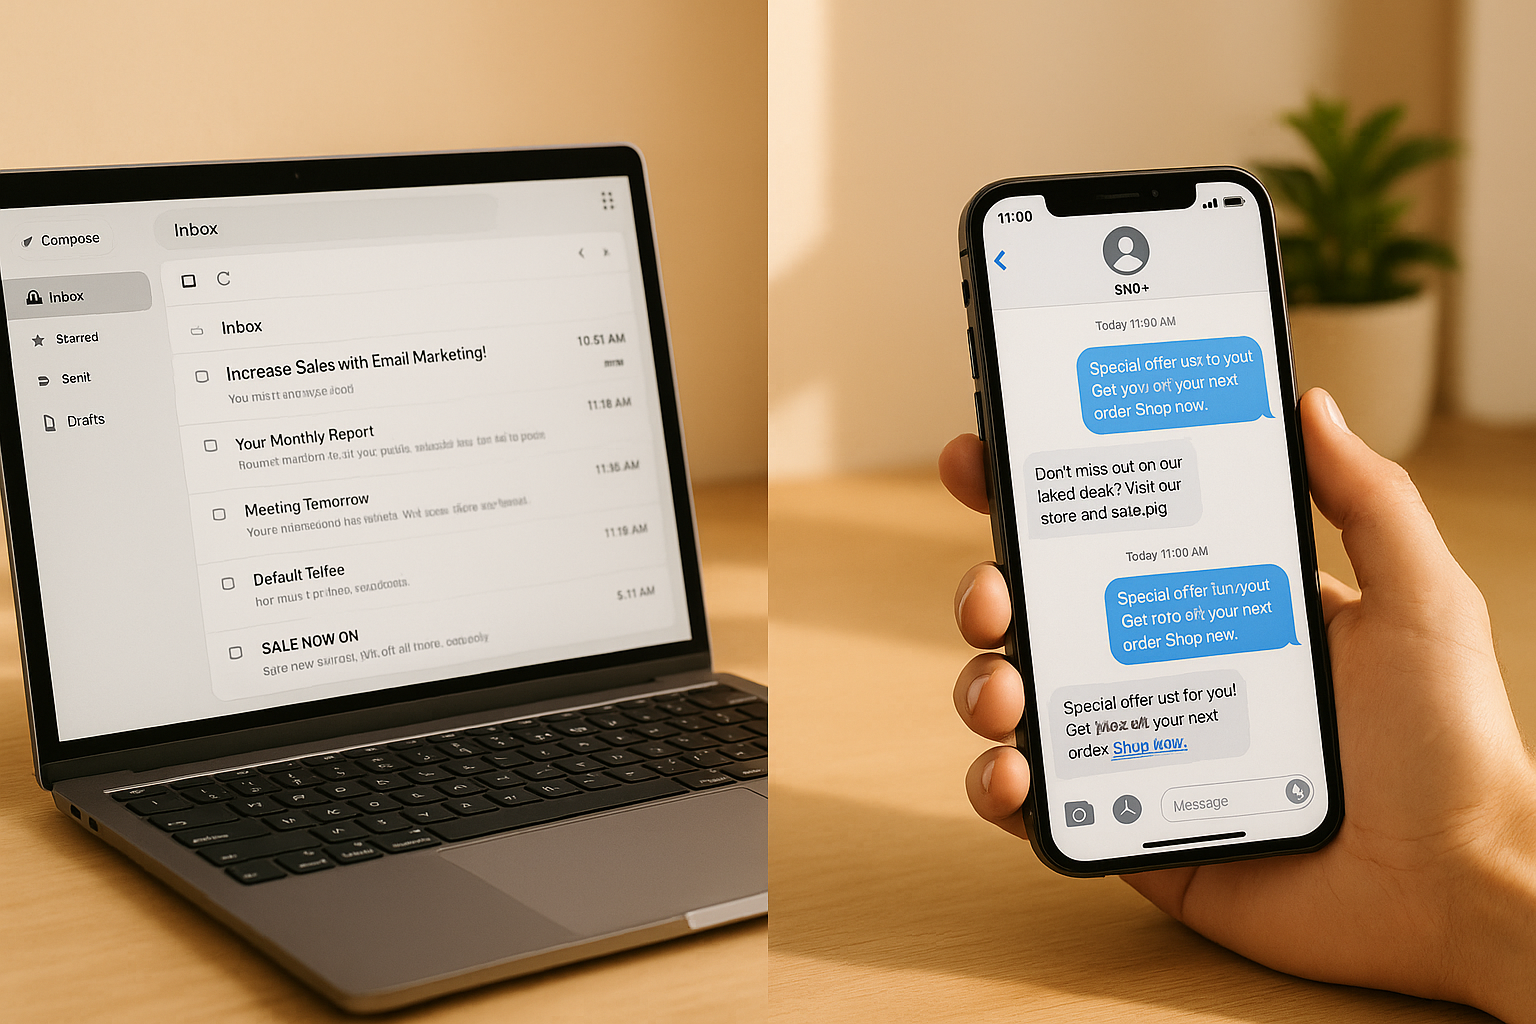
D2C growth secrets, dropped in your inbox
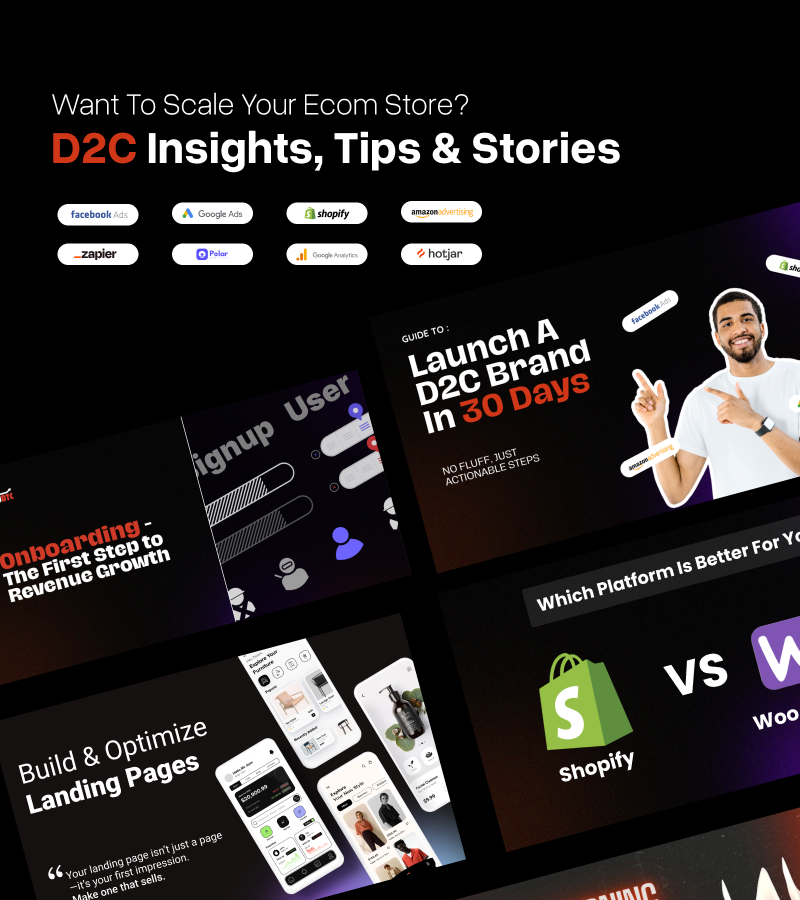
We write what D2C founders should actually care about
Oops! Something went wrong while submitting the form.
We write what D2C founders should actually care about

Our True CAC & ROAS Calculator lets you plug in all the real‑world costs behind acquiring a customer—COGS, shipping, packaging, return shipping (RTO), transaction fees (fixed at 2%), and any “other charges” you incur. Then, instead of the inflated “vanity metrics” you see in Meta, Google Ads or Shopify dashboards, it spits out:


All in one place, in seconds, so you can make data‑backed decisions on scaling your D2C brand.
When you look at Meta or Google Ads dashboards, they treat every paid conversion as an equal “win”—but in the real world, a hefty chunk of those orders never stick. Here’s why that matters:
By ignoring RTO, Meta/Google dashboards give you a false sense of efficiency. You think you’re acquiring customers at ₹500, but each one really costs you ₹714 once returns are factored in—plus you’ve buried another ₹30×100=₹3,000 in return‑shipping fees. That gap is exactly what our tool uncovers.
We write what D2C founders should actually care about
Your One Stop D2C Knowledge Hub. Actionable insights which get you results.

.avif)


%20(2).webp)


.jpg)
